Grafana: Pie Chart
Aus Wiki-WebPerfect
Version vom 30. August 2021, 12:32 Uhr von Admin (Diskussion | Beiträge)
Following are two examples to make great Pie Chart with Grafana and InfluxDB Flux.
Inhaltsverzeichnis
One Query -> multiple Pie slices (recommended)
This works only with Grafana 8.x or higher!
InfluxDB Flux Query
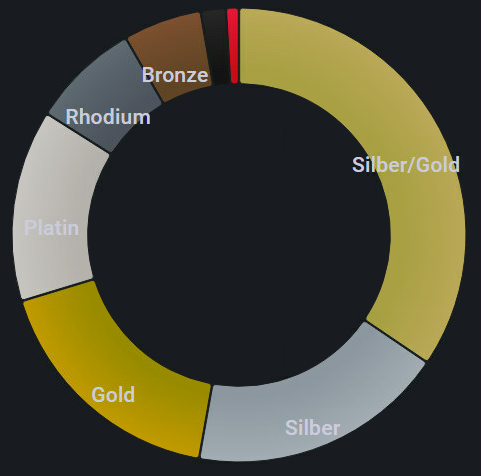
Create a Grafana Pie chart panel that shows the count of unique hosts per SLA. We named the SLA's (in Influx tag "sla") as precious metals for example "Gold".
//define variables
bucket = "<YOUR_BUCKET>"
measurement = "<YOUR_MEASUREMENT>"
field = "<YOUR_FIELD>"
group = "<YOUR_GROUP/YOUR_SLICES>" //in this examples the SLA

from(bucket: bucket)
  |> range(start: v.timeRangeStart, stop: v.timeRangeStop)
  |> filter(fn: (r) =>
    r._measurement == measurement and
    r._field == field
  )
  |> last()
  |> group()
  |> unique(column: "host")
  |> group(columns: ["sla"])
  |> count()
  |> rename(columns: {_value: ""}) //remove _value from Pie slice naming
Multiple Queries -> multiple Pie slices
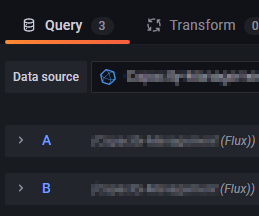
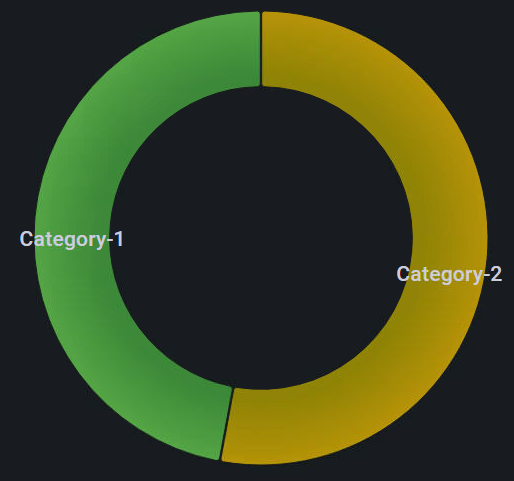
This works also before Grafana 8.x. Add multiple Queries in the Grafana panel:

InfluxDB Flux Query 1 (for Category-1)
//define variables
bucket = "<YOUR_BUCKET>"
measurement = "<YOUR_MEASUREMENT>"
field = "<YOUR_FIELD>"

from(bucket: bucket)
  |> range(start: v.timeRangeStart, stop: v.timeRangeStop)
  |> filter(fn: (r) =>
    r._measurement == measurement and
    r._field == field
  )
  |> last()
  |> group()
  |> keep(columns: ["host"])
  |> distinct(column: "host")
  |> count()
  |> rename(columns: {_value: "Category-1"})
InfluxDB Flux Query 2 (for Category-2)
//define variables
bucket = "<YOUR_BUCKET>"
measurement = "<YOUR_MEASUREMENT>"
field = "<YOUR_FIELD>"

from(bucket: bucket)
  |> range(start: v.timeRangeStart, stop: v.timeRangeStop)
  |> filter(fn: (r) =>
    r._measurement == measurement and
    r._field == field
  )
  |> last()
  |> group()
  |> keep(columns: ["host"])
  |> distinct(column: "host")
  |> count()
  |> rename(columns: {_value: "Category-2"})

