InfluxDB 2.x: Empty default bucket "monitoring"
Aus Wiki-WebPerfect
Version vom 23. Juni 2021, 11:21 Uhr von Admin (Diskussion | Beiträge)
- Maybe you noticed the default InfluxDB 2.x bucket "_monitoring" is empty. You can't find any information's about this because there is a lack in the InfluxDB documentation.
- Or you noticed the Grafana Dashboard (https://grafana.com/grafana/dashboards/13315) is not working.
Cause
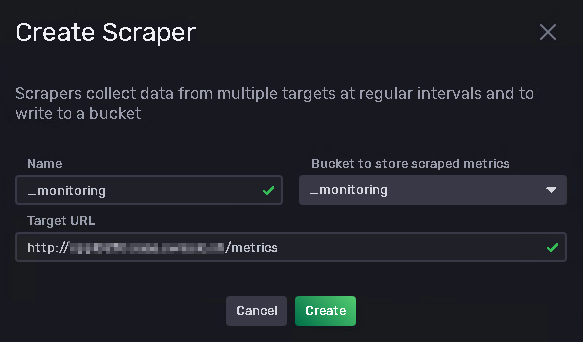
This is because your InfluxDB missing a scraper to get this data.
Solution
- Create a scraper like this:

