Hyper-V: Performance (Counters): Unterschied zwischen den Versionen
Admin (Diskussion | Beiträge) K |
Admin (Diskussion | Beiträge) |
||
| Zeile 1: | Zeile 1: | ||
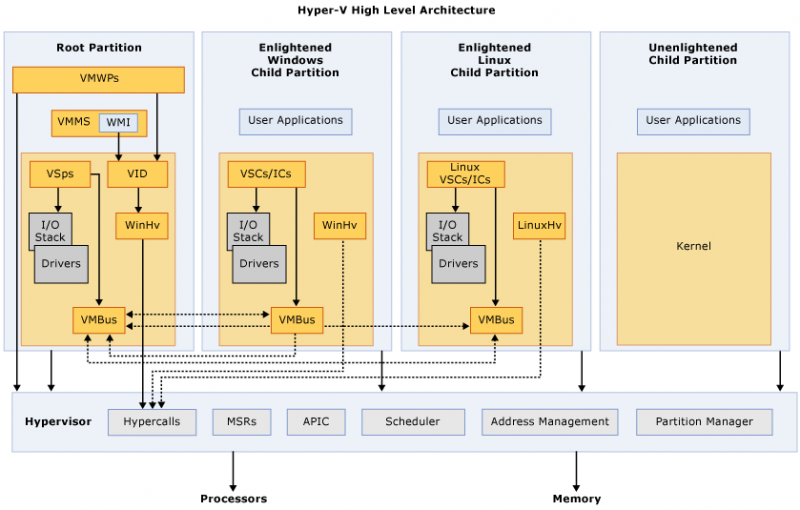
| + | [[Datei:00-hyper-v architecture-docs.png|800px|right]]<br> | ||
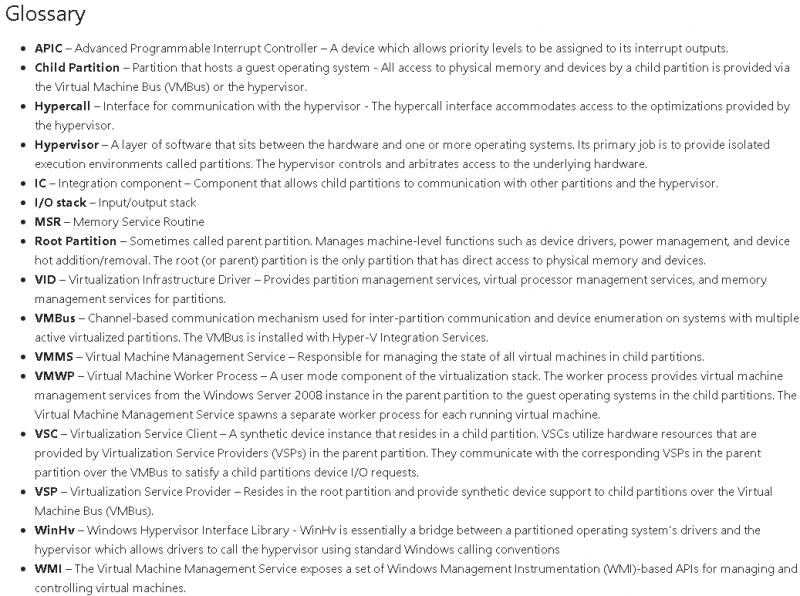
| + | [[Datei:00-hyper-v architecture glossary.png|800px|right]] <br> | ||
Version vom 6. Dezember 2017, 16:43 Uhr
Inhaltsverzeichnis
[Verbergen]- 1 Recommended Performance Counter
- 1.1 Hyper-V Hypervisor Logical Processor
- 1.2 Hyper-V Hypervisor Virtual Processor
- 1.3 Hyper-V Hypervisor Root Virtual Processor
- 1.4 CPU Wait Time per Dispatch
- 1.5 Physical CPU Context Switching
- 1.6 Memory
- 1.7 Memory (NUMA)
- 1.8 Hyper-V Dynamic Memory
- 1.9 LogicalDisk
- 1.10 PhysicalDisk
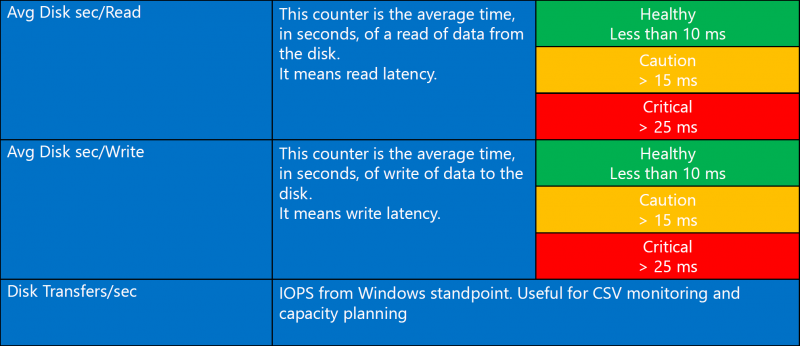
- 1.11 Cluster Shared Volumes
- 1.12 Network Interface
Recommended Performance Counter
Hyper-V Hypervisor Logical Processor
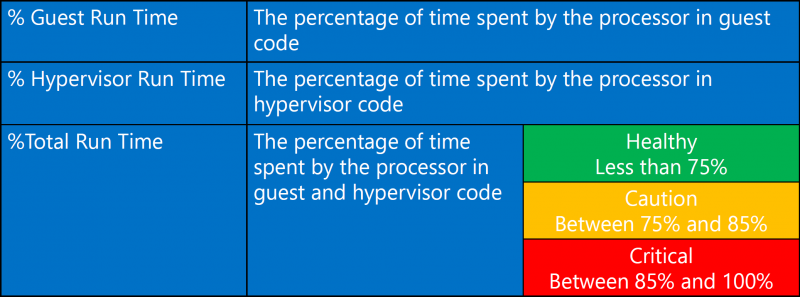
There is one instance of HVH Logical Processor counters available for each hardware logical processor that is present on the machine. The instances are identified as VP 0, VP 1, …, VP n-1, where n is the number of Logical Processors available at the hardware level. The counter set is similar to the Processor Information set available at the OS level (which also contains an instance for each Logical Processor). The main metrics of interest are % Total Run Time and % Guest Run Time. In addition, the % Hypervisor Run Time counter records the amount of CPU time, per Logical processor, consumed by the hypervisor.
Hyper-V Hypervisor Virtual Processor
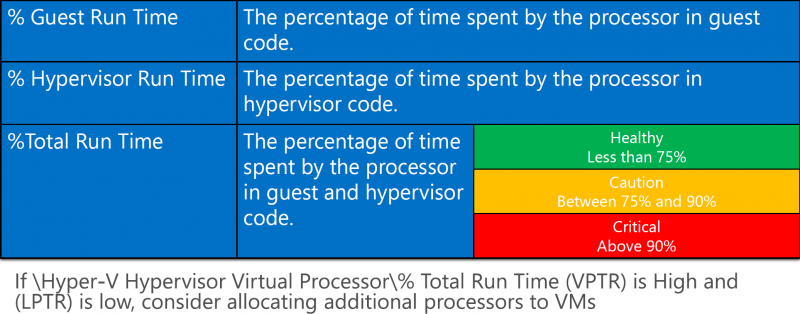
There is one instance of the HVH Virtual Processor counter set for each child partition Virtual Processor that is configured. The guest machine Virtual Processor is the abstraction used in Hyper-V dispatching. The Virtual Processor instances are identified using the format guestname: Hv VP 0, guestname: Hv VP 1, etc., up to the number of Virtual Processors defined for each partition. The % Total Run Time and the % Guest Run Time counters are the most important measurements available at the guest machine Virtual Processor level.
Hyper-V Hypervisor Root Virtual Processor
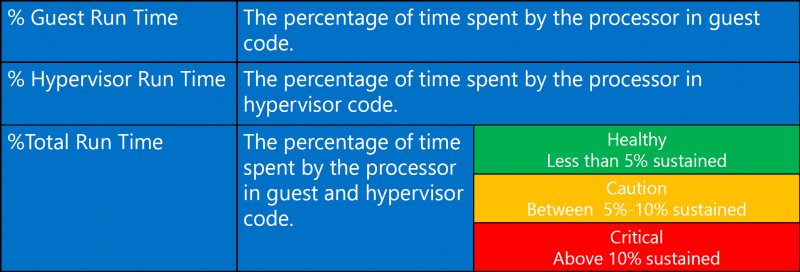
The HVH Root Virtual Processor counter set is identical to the metrics reported at the guest machine Virtual Processor level. Hyper-V automatically configures a Virtual Processor instance for each Logical Processor for use by the Root partition. The instances of these counters are identified as Root VP 0, Root VP 1, etc., up to VP n-1.
CPU Wait Time per Dispatch
CPU wait time per dispatch (Hyper-V). Show the average queue time for the virtual machine waiting for CPU to become available, which comparable to the OS Scheduler’s Ready Queue. Unfortunately. Not much has been written about this extremely useful counter, except just acknowledging its existence.
VMware by default takes a 20 second capture interval & provides a summation of time spent in Ready state. So you might find a value of 1500ms for a 20 second capture period. To get to a percentage you would simply take the 1500ms value & divide it by the amount of milliseconds in the 20 second capture period (20,000); then multiply by 100 to get a percentage of 7.5%.
Calculate "CPU Wait Time per Dispatch" in %:

- Wait: The average time (in nanoseconds) spent waiting for a virtual processor to be dispatched onto a logical processor.
- Counter: Hyper-V Hypervisor Logical Processor\CPU Wait Time per Dispatch
- Threshold:
- <2.5% CPU Ready -> Generally No Problem!
- 2.5% - 5% CPU Ready -> Minimal contention that should be monitored during peak times
- 5% - 10% CPU Ready -> Significant Contention that should be investigated & addressed
- >10% CPU Ready -> Serious Contention to be investigated & addressed ASAP!
- What to do if threshold is exceeded:
- Check the virtual core to physical core ratio (Overcommitment of the CPUs)
- Check the CPU load of all VMs on the same hypervisor
- Keep in mind that setting CPU Reservations does not solve CPU Ready,
Physical CPU Context Switching
- What: This measures the rate (number of times per second) each logical CPU changes what virtual processor it is running.
- Counter: Hyper-V Hypervisor Logical Processor(*)\Context Switches/sec
- Threshold: (any instance (Core) except for "_Total") > 20000, (sustained for > 5min).
- Why: We use this as a general health & performance indicator for the host & virtual machines. This counter must be used in context with all other activity based counters (CPU, Disk & Network, latency & throughput).
- What to do if threshold is exceeded:
- Check VM config (particularly remove / disable any active & busy emulated devices)
- Check that the VM is using the correct version of the integration components.
- Check host operating system utilization Root VP CPU usage (host OS utilization) - see the "Hyper-V Hypervisor Root Virtual Processor" counter section for the specifics.
- Check drivers - particularly network and storage drivers, but other too.
- Check for significant inconsistency across your hosts - it can indicate significant configuration or load differences.
Memory
Memory (NUMA)
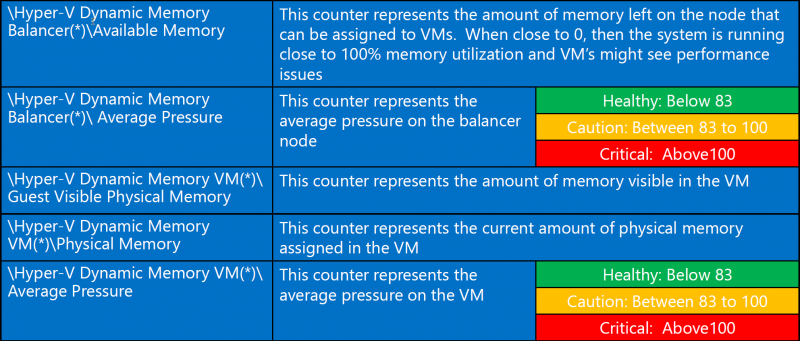
Hyper-V Dynamic Memory
LogicalDisk
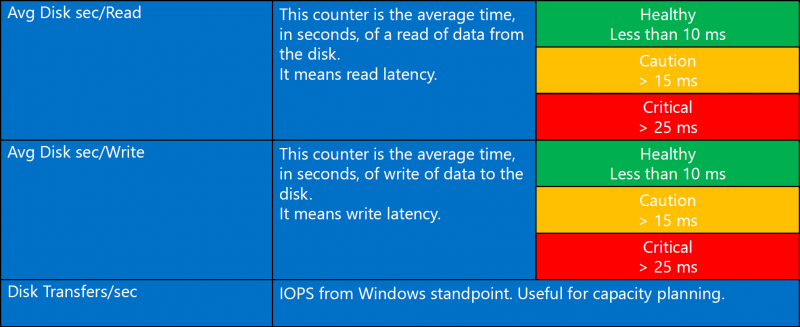
PhysicalDisk


(> 1 MB/s) indicates Shared VHDX files or that CSV is in redirected mode.
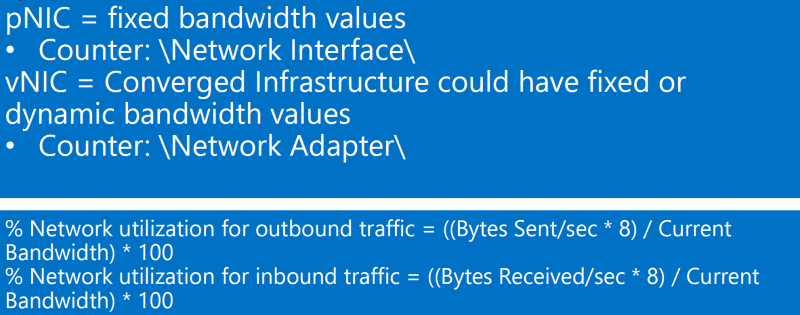
Network Interface
Weitere Informationen:
- https://blogs.technet.microsoft.com/neales/2016/10/24/hyper-v-performance-cpu/
- http://computerperformancebydesign.com/hyper-v-architecture/
- https://blogs.msdn.microsoft.com/clustering/2014/06/05/cluster-shared-volume-performance-counters/
- http://www.enowsoftware.com/solutions-engine/bid/187606/CPU-Contention-and-Exchange-Virtual-Machines
