Grafana: Graph - Noise Range: Unterschied zwischen den Versionen
Aus Wiki-WebPerfect
Admin (Diskussion | Beiträge) |
Admin (Diskussion | Beiträge) |
||
| Zeile 1: | Zeile 1: | ||
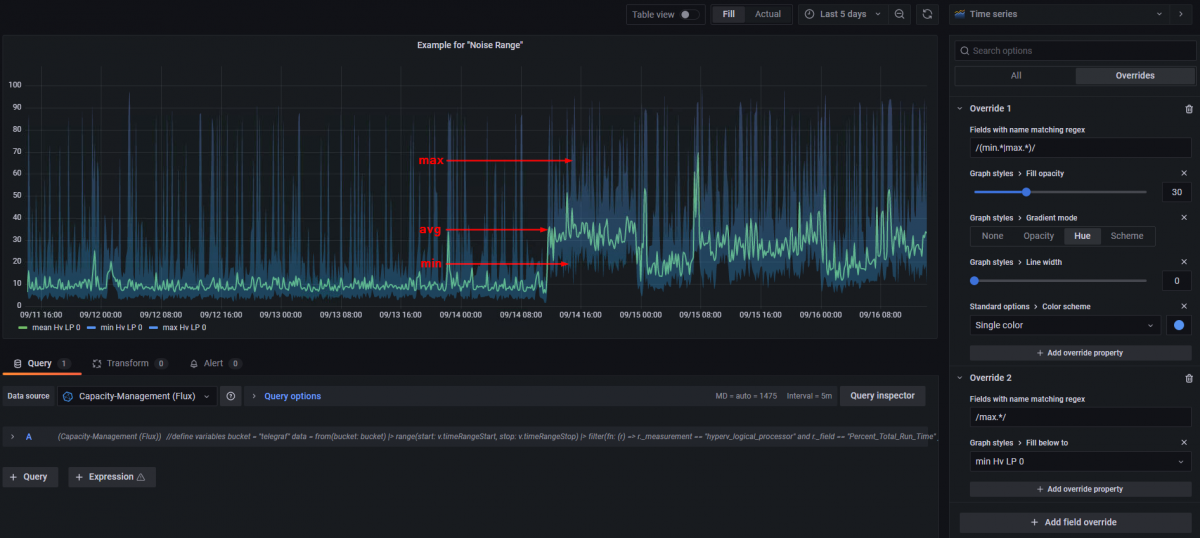
| − | If you want a Grafana Graph that shows | + | If you want a Grafana Graph that shows the average CPU usage as a line but also the min and max value as a area in the background, then following this site. <br> |
[[Datei:01-noise range.png|1200px]] <br> | [[Datei:01-noise range.png|1200px]] <br> | ||
Version vom 16. September 2021, 14:20 Uhr
If you want a Grafana Graph that shows the average CPU usage as a line but also the min and max value as a area in the background, then following this site.
